Hello, I am new to the app and sleep tracking and I am finding this so much more helpful than just Samsung Health reports. I am confused about something though.
What in the world are the little red dots with numbers on the image? I promise I have tried to do my own looking but those don’t fit what I’m seeing in the user guide.
Thank you all so much for your help, in advance. Happy sleeping!
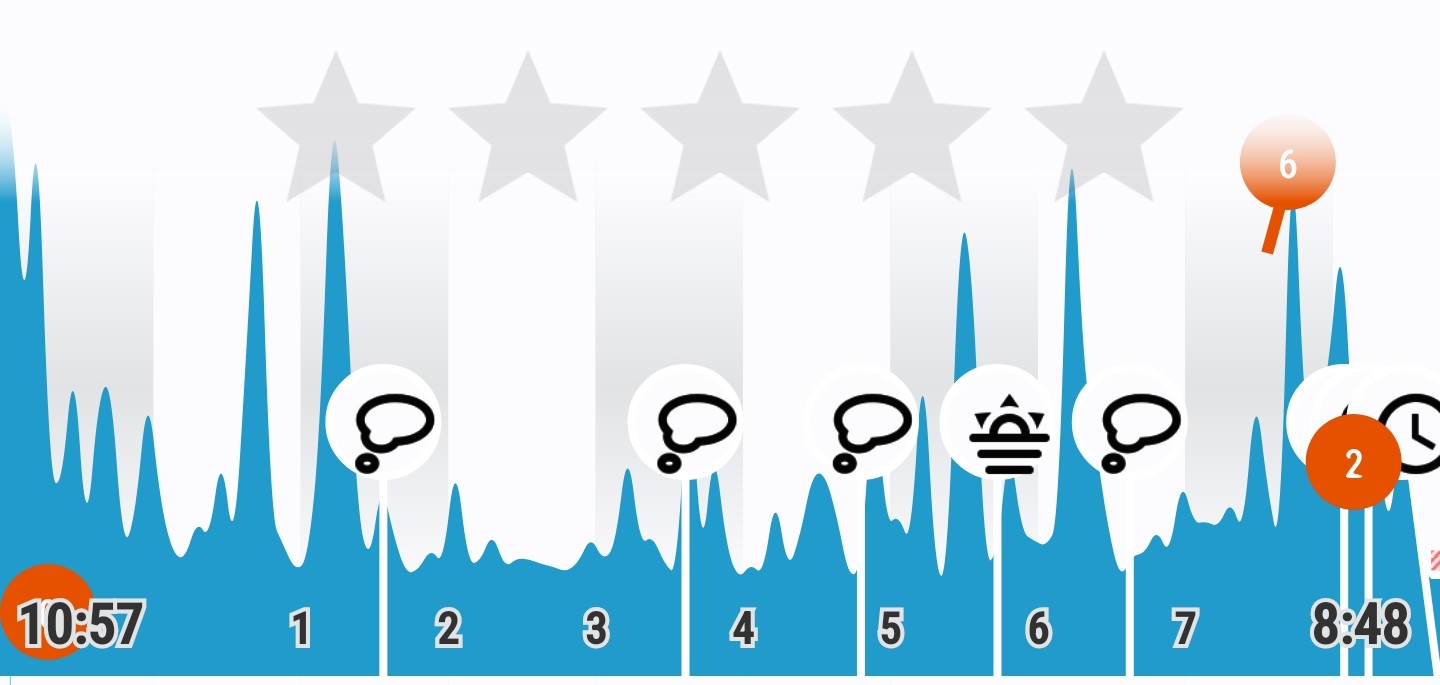
Hello Stefany, the orange line on the graph is light level (from the ambient light level sensor on the phone, usually located close to the front camera). The numbers represent the local min and max values.
The app does not show all data, if the values are too low and fluctuating, so it does not cover the rest of the graph content.
There is a Legend in the (?) menu (top right corner), but most elements are color-coded, so probably not designed for black-white mode. Is your phone in grayscale mode the whole day, or in the morning after the alarm as well?
The line on the actigraphy is always light level. HR, SpO2, HRV, or breath rate data have their own graph at the bottom (Sensors graph).