The graph screen shows up to three graphs:
Graph screen also shows statistics about your night, along with an option to rate and annotate the record.
This is a companion discussion topic for the original entry at https://sleep.urbandroid.org/docs/sleep/how_to_read_sleep_graphs.html
2 Likes
The summary shown after waking and stopping tracking used to show how long I slept. Please bring this back! It is really the only thing I want to know and seems obvious, but it is now gone! It would also be nice to see the overall sleep deficit, etc. The newer summary is insufficient.
Did you dismiss this card by mistake?
1 Like
Hi @James_Hendrix, could you please check, if the “Hide stats before rating” is not enabled (Settings > Personalized > Morning screen)? This feature hides the stats on SleepScore card.
i am new to this app and the sleep data is so confusing when you look deep into it. I mean, the first night it gave me a sleep score of 99% so that should be good but i dont understand all the graphs and statistics.
Hi @mugen4u, could you please share the graph, so I can walk you through the results? Or you can contact directly support@urbandroid.org.
You should see:
- The sleep score board with statistics (explained in details in the SleepScore chapter)
- Hypnogram - showing sleep phases progress in time
- Actigraph - showing movement intensity in time
- Noise graph (if Sleep Noise Analysis is enabled) - showing the noise level, and sound classes detected with the icons
- Sensor graphs (depending on the data available) - could be Heart rate, HRV, SpO2, Respiratory rate
i doubt the results are reliable because it says i had about 65% deep sleep.
If you have an unusual amount of deep sleep, the sensor has troubles reading your movement - either the phone is too far away, or the data set has gaps. Which sensor do you use? You can use the Left ≡ menu → (?) Support → Report a bug, and send the application logs, I will check them on Monday.
You can read our post about our method and results reliability on our blog here.
if i am correct, my smartwatch registrated everything and not my phone. i installed the program on my phone and smartwatch and started recording on my watch (and automatically started on my phone after that).
Hi, for some reason, I did not find your logs in the support inbox. Could you please send them again? You should get an automatic reply as a confirmation.
We do not have any access to our users data.
1 Like
I’ve been a long time user and i use my smartwatch as well. Upload your results as requested and these fine folks will help ensure you have everything set up for optimum results, and they will help you understand all the data.
This app is very powerful, many many features that are quite useful for some like me who have severe sleep issues. Part of the journey is fine running things for your hardware and use case.
I have no idea what the app is doing anymore. A few versions ago it was nice and easy, now it says I’ve had hours of rem sleep but a total sleep score of less than two hours. I’ve been using the app for yonks but it’s becoming increasingly less useful.
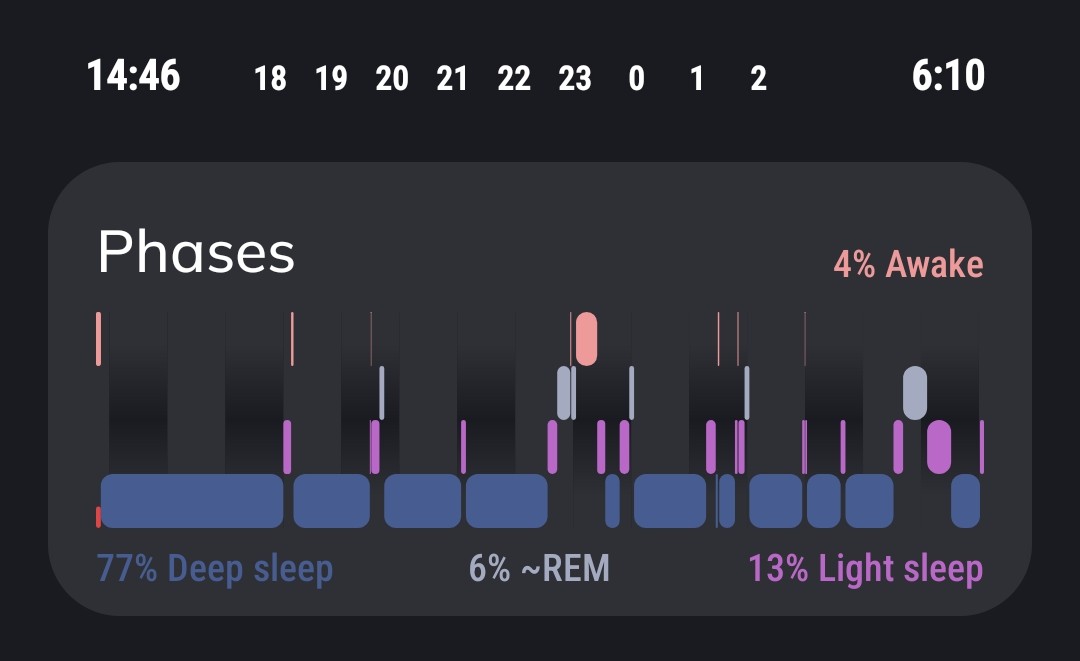
My daily sleep summary shows something called “Phases” that I wanted to see more information on. When I click on it, it just sends me to the Hypnogram. I also can’t seem to find any documentation on this. Can I get more info on it please?
Hi @ShoalBear, the Phases graph shows the same as the hypnogram, with just slightly different design. It shows a progress of your sleep phases in time.
Hypnogram uses bar columns, Phases graph uses lines.
What information about the Phases graph would you like to see?
On your example, it shows a sleep between 14:46 and 06:10 (which is quite unusual length), awake period in light orange, deep sleep in darker blue, REM in light blue, and light sleep in pink.
1 Like
Hi again Lenka.
Is there any info about the phases and how they should look. Like in my example (which is long because I have narcolepsy and so sometimes have really long sleeps), it looks like sometime REM is followed by deep sleep, but sometimes by light sleep. Is that “normal” or should you always go from REM to a particular level of sleep?
More out of curiosity than anything else.
*Sorry for the delay in reply… you know that pesky thing called life got in the way. LOL
Hi, the graph design is derived from the standard “Hypnogram” (Wiki page for hypnogram), which shows awake - REM - non-REM-1, non-REM-2 and non-REM-3. In most sleep tracking apps, the non-REM phases are not used, but the non-REM-1-3 are divided into “deep” and “light”.
Typically, the REM is followed by either awake or non-REM-1 (light sleep), but its duration may be really short and then can quickly move to deep sleep.
But these rules apply to a normal sleep. Any sleep disorder, like narcolepsy, can change your average sleep pattern. We sadly do not have enough data from sleep labs to train our algorithms for narcolepsy at the moment.
If you think the stages are not detected, you can send me the logs (Left ≡ menu → (?) Support → Report a bug), and I can check, if the data are not distorted.
If you feel your sleep patterns are off, maybe consult them with your doctor.
If you take any medication, we recommend marking this as a tag to your graphs. You can create your personalize tags to monitor any aspect, even medicine - so you can have #xyrem or #melatonin tags, that the app will use for the graphs and for the long-term stats.